Centralized logging got built for one reason. chasing the same “what the hell just happened” clues across eight VMs is a great way to waste an evening and learn nothing useful. The goal was a single place to see what every node is doing in real time, with a quick activity chart and the actual log lines right next to it. Grafana lives at r9-ctrl:3003, and it’s pulling logs from eight Linux VMs total, five Rocky boxes and three Ubuntu boxes.
The stack is straightforward, Grafana is the UI, Loki is the log database, Promtail runs on each VM and feeds Loki. Loki becomes the center of gravity, once logs are indexed and labeled there, Grafana can slice the noise into something usable. The point isn’t “pretty dashboards”, I just needed cleaner visibility, and a setup that scales as the lab grows.
The rollout started the right way, manually on the control node first and then on a single Rocky VM to validate the flow end to end. Once logs were landing in Loki and showing up in Grafana, the whole thing got turned into automation. Two Ansible playbooks came out of it, one for Rocky and one for Ubuntu to keeps it predictable and future changes clean.
Rocky uses Podman, a real Podman wrinkle showed up during automation that’s worth calling out. One node failed pulling the Promtail image with a short name resolution prompt that can’t appear in a non interactive Ansible run.
Ubuntu stayed aligned with the same mental model so the pipeline behaves the same from Grafana’s perspective, even if the runtime changes later. The long term plan is likely Docker on Ubuntu and Podman on Rocky.
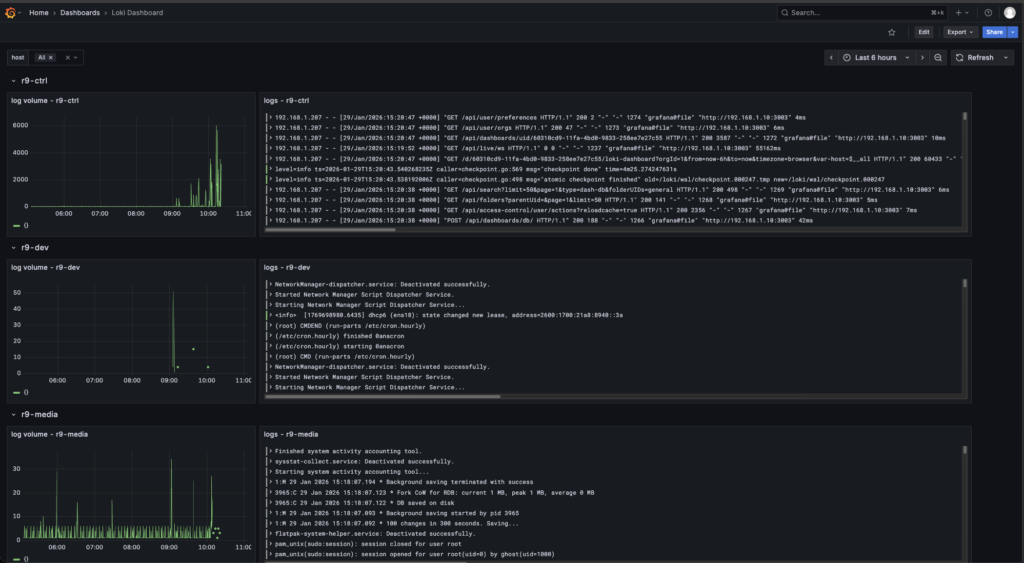
Grafana is only as useful as the LogQL you feed it, so the dashboard work focused on a few dead simple queries that answer real troubleshooting questions fast. A broad stream query that always works, like {job=”systemd-journal”} and then filtering down with text matches such as |= “error” or |= “failed” when something smells off. Once labels were flowing correctly from Promtail, the next step was narrowing by host and by identifier {job=”systemd-journal”,host=”r9-node1″} or {job=”systemd-journal”,syslog=”loki_test”} for targeted sources. The next part is expanding that same idea into clean separation and better labels so systemd, container logs, and network logs aren’t all dumped into one noisy stream.